
Social ranking app for people and businesses
Rateam8
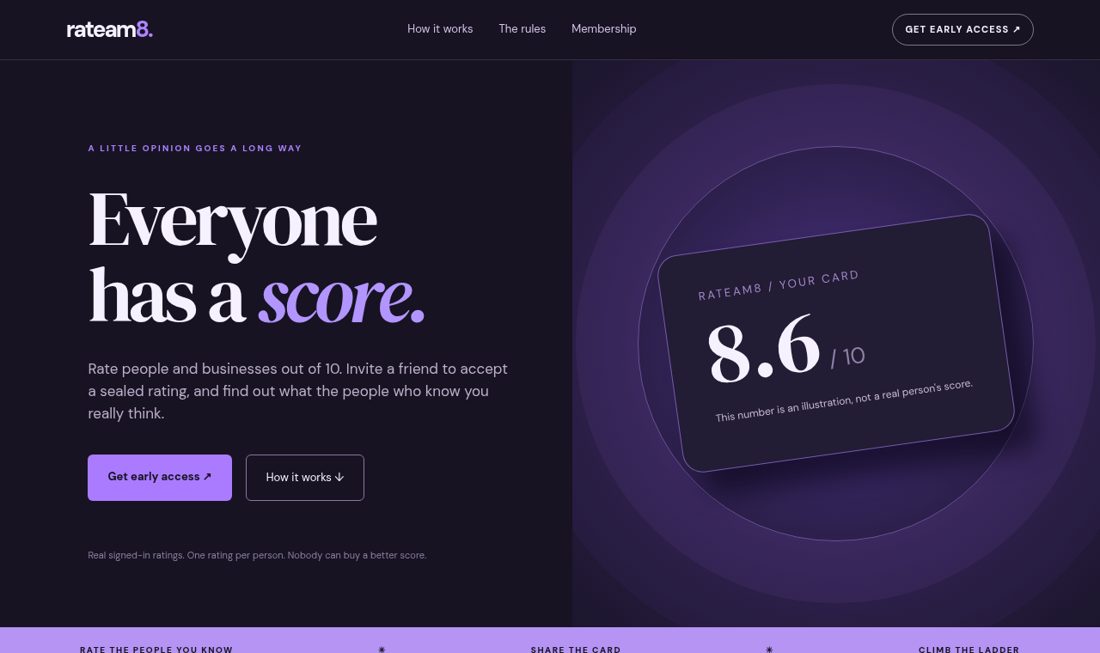
Everyone has an opinion. Give yours a score, and a reason.
Early access
Join the Rateam8 waitlist
Leave your email and we will write to you once, when Rateam8 is ready. No spam. We use your email only to tell you when Rateam8 is ready. We do not sell it or use it for anything else. A network identifier is also stored to limit abuse. To have your entry deleted, write to [email protected].
What it is
Rateam8 takes the ratings people trade in group chats and gives them a format: a score from 1 to 10, with reviews and comments. The concept covers people and businesses, turning a quick reaction into a conversation about what sits behind the number.
- People and businesses
- 1 to 10 ratings
- Reviews and comments
Who it is for
Young social users who already rate everything in group chats.
How it earns
Free with planned paid features.
Category
Social ranking app for people and businesses
The thesis
Why this category, and why we are not first
Rating apps win when ranking becomes a social game. Beli logged 30M reviews in 2024 and Yelp earns $1.46B a year from local reviews. Rateam8 applies the same loop to people, places and businesses together. We enter after the leaders have proved the behaviour, and compete on a faster, more playful ranking format.
Market size
Sector size: no reliable estimate yet
We looked for a credible, citable sector-size figure for this category and did not find one, so we are not showing one. The competitor figures below are company metrics, not a sector estimate.
Ranking people is the highest-risk part of this idea. We have not found a comparable current public sizing and are not publishing one. Moderation and safety design are core to the product, not an add-on.
Competitors
Who is in the space and what they earn
| Company | What it is | Scale (as published) | Source |
|---|---|---|---|
| Beli | Personal ranking of places | 30M reviews in 2024 | Food Network (Aug 2025) |
| Yelp | Local reviews and advertising | $1.46B net revenue, 2025 | Yelp 2025 results |
Figures marked estimate come from third-party app trackers and are approximate. "No verified figure" means we looked and found no reliable public number, so we show none.
Where in the world
Where the downloads are
We aim to launch worldwide. Download volume is the best country-level data that is public across every category, so here are the ten biggest app markets and how each moved last year.
Source: AppTweak, App downloads by country (Dec 2025). Both stores, Nov 2024 to Nov 2025, all app categories.
For Rateam8
Priority markets are an editorial judgement: India and the US first. The US ranks second by downloads and monetises well (AppTweak).
The $100 million ambition
What a $100 million a year Rateam8 would take
A scenario, not a forecast and not expected revenue. $100 million a year in revenue in three years is the ambition we are building toward. This is the arithmetic of it: how many paying subscribers that takes at three illustrative prices. Rateam8 has no such traction today and nothing here is a promise.
Illustrative price points chosen for the maths. They are not Rateam8's pricing. The numbers here are a scenario, not results.
Sources
Checked October 2026. Market-research publishers often disagree with each other, so where two estimates exist we show both.
Competitive intelligence · 27 October 2026
Comparators, revenue evidence and advertising
What public evidence supports, and what it does not. Named comparators are not a claim of an exhaustive leader ranking.
Advertising snapshot
- Yelp: ~44 active-ad results. Open page-scoped ad library and creatives
Meta Ad Library observations on 27 October 2026, all countries, active-ads filter, limited to the linked advertiser page. Counts are approximate displayed results, not unique creative concepts, spend, reach, customers or performance. Other pages and channels may carry additional ads. Display limits are not treated as evidence that a count is a lower bound.
What remains unknown
This is a selected-comparator snapshot, not an exhaustive category ranking. No new verified app-level subscription MRR was established in this pass. Existing revenue figures above keep their original sources, scopes and dates.
No reliable public marketing-budget figure was located for the comparators covered in this review. Ad counts are not budget estimates. Acquisition cost, conversion, retention and return on ad spend remain unknown unless separately sourced.
Research reviewed 27 October 2026. Reported company results, store-revenue models and subscription MRR are different measures. This update does not revalidate every older figure elsewhere on the page. Existing country-download context is all-app market data, not this category's demand. Any $100 million scenario remains illustrative, not a forecast.